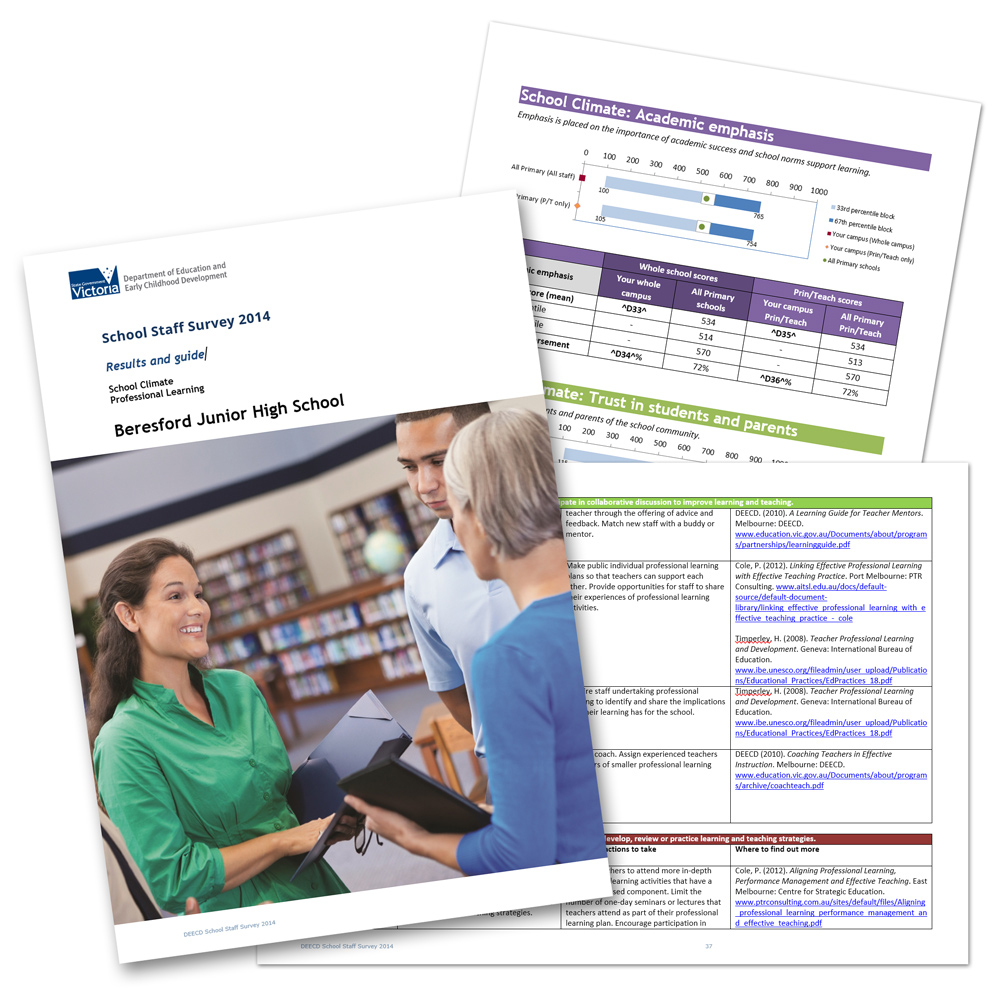
Access high-powered analytical and mass reporting capabilities
How do we analyse the data for 2,000 organisations?
Then how do we design and create individual reports for these 2,000 organisations?
And, we need this done quickly.
ASR is the proven choice . . .
- We do the analytics
- We design the reports with you
- We program the reports and create them
- You or we distribute the reports

How it works for you
- You send us your data in whatever format you have it stored.
- Alternatively, we design the data collection process or survey with you
- We collect data collected by a combination of techniques:
- Web (desktops and tablets)
- Mobile phones (using email and SMS notifications)
- Paper
- Telephone
- Focus groups
- You specify the type and format of the reports you require, as well who is allowed access.
- We load it into our analytical software systems and conduct numerical, statistical and textual analyses
- We build reports to your specification.
- You review the format and content of the reports over the Intranet and, over the telephone, and we make any adjustments you require in real time.
- We finalise the look and content of the reports.
- We convert them to PDF format
- We set up the access rules to your data, eg, public access, access restricted to designated colleagues, customers, suppliers, stakeholders, etc.
- The availability of the reports is publicised to your designated target groups.
- We manage routine uploads of fresh data, answer user queries, and provide usage reports to you.
ASR can create reports which contain context-sensitive narrative alongside graphical and tabular displays of the data, together with other individualised features for each organisation. These are superior to IT dashboards as they are complete standalone documents.
A simple all-in-one solution
We can help you manage the complete data collection, analysis and reporting process from small to very large data sets.
Software tools
- Survey Manager for data collection and surveys
- SurveyManager custom report writer
- Various web dashboards
- Aspose for automated server-side reports in Word and Excel
- E-Tabs for report automation in Word, Excel and PowerPoint.
E-Tabs
E-Tabs Enterprise automates the production of charts, graphs, and summary reports directly from research data. Any analyst working with continuous tracking or multi-segment projects spanning several brands or regions will be aware of the time it takes to generate reports. They extract data from multiple tables, collate, summarise and analyse the figures before inserting them into PowerPoint, Excel or Word reports. Having to reproduce those sets of slides for each market, region, brand or wave is time-consuming and error-prone, and diverts researchers from analysis to administrative tasks.
With E-Tabs Enterprise, ASR can automate all of this and more. There is no need to sacrifice any special chart types, and we can use your existing Word, Excel and PowerPoint templates.